BladeRF HF Experimentation- Exp1
This post should be part of a series of posts that help document my experiments for using the BladeRF x40 on HF (3-30 MHz) with the XB-200 transverter board.
Note: it is poorly written, I will improve my organization and writing as I figure out more things and do more experiments. This post will probably be edited every once and a while as I improve and organize things.
General Method
I will be using the WSJT-X software for this series of experiments because a) many people use it, b) some modes have a standard set of data it gives, and c) many signals can be received from far away; So, I can create a nice set of data points :)
The signal is received by the BladeRF, demodulated in GQRX, and audio is looped back into WSJT-X (Guide I semi-followed).
This first experiment was conducted on March 10, 2021
Experimental Setup:
Mode: FT8 on 40 Meters (7.074 MHz)
Icom: Preamp 2, Receive Filter 1.8 kHz, Untuned, Random Wire Antenna
BladeRF: Bandwidth 10 MHz, GQRX Audio Gain -15 dB, Random Magnet Wire Antenna (appx. 40 M)
Filter Path: Antenna > AM reject filter > FM reject filter > LNA > BladeRF RXANT (J12) port; RXFILT (J8) > HF band pass filter > RXFILT-ANT (J9)
Data
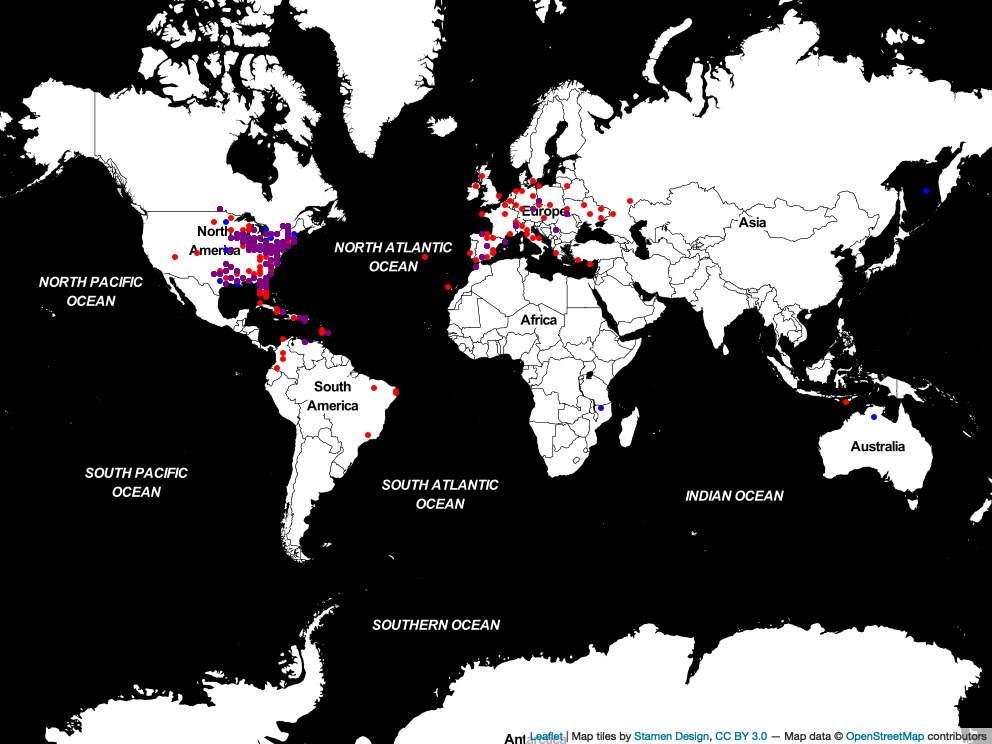
As we can see from the above map, the Icom heavily out preformed the BladeRF. This is probably due to the better filtering on the Icom, which is expected. One purpose of these is experiments is to find a good filter configuration to help increase the sensitivity for the BladeRF. There are some strange outliers like grid squares PH64 and QO53 (also RR73 but no signal was probably received from there, that was just laziness on me not removing it).
You can find the raw data here: these are the logs from WSJT-X. They probably could be formatted better, as I just coped and pasted from the program (there probably is a better way to export it). So far not much data analysis has been done, but I will probably continuously update this post as a do stuff.
Some info on the image and interactive map: The data processing was done by an R script written by my friend Nick (KM4YHI): It can be found here. This script will be updated as more features are added. As of right now, I just made a list out of every grid square that appears in the data, and I cross reference data received from the Icom and BladeRF to get a general idea of what has been received from what.